
| Indicator | Value | Z-Score (max 20d/60d) |
|---|---|---|
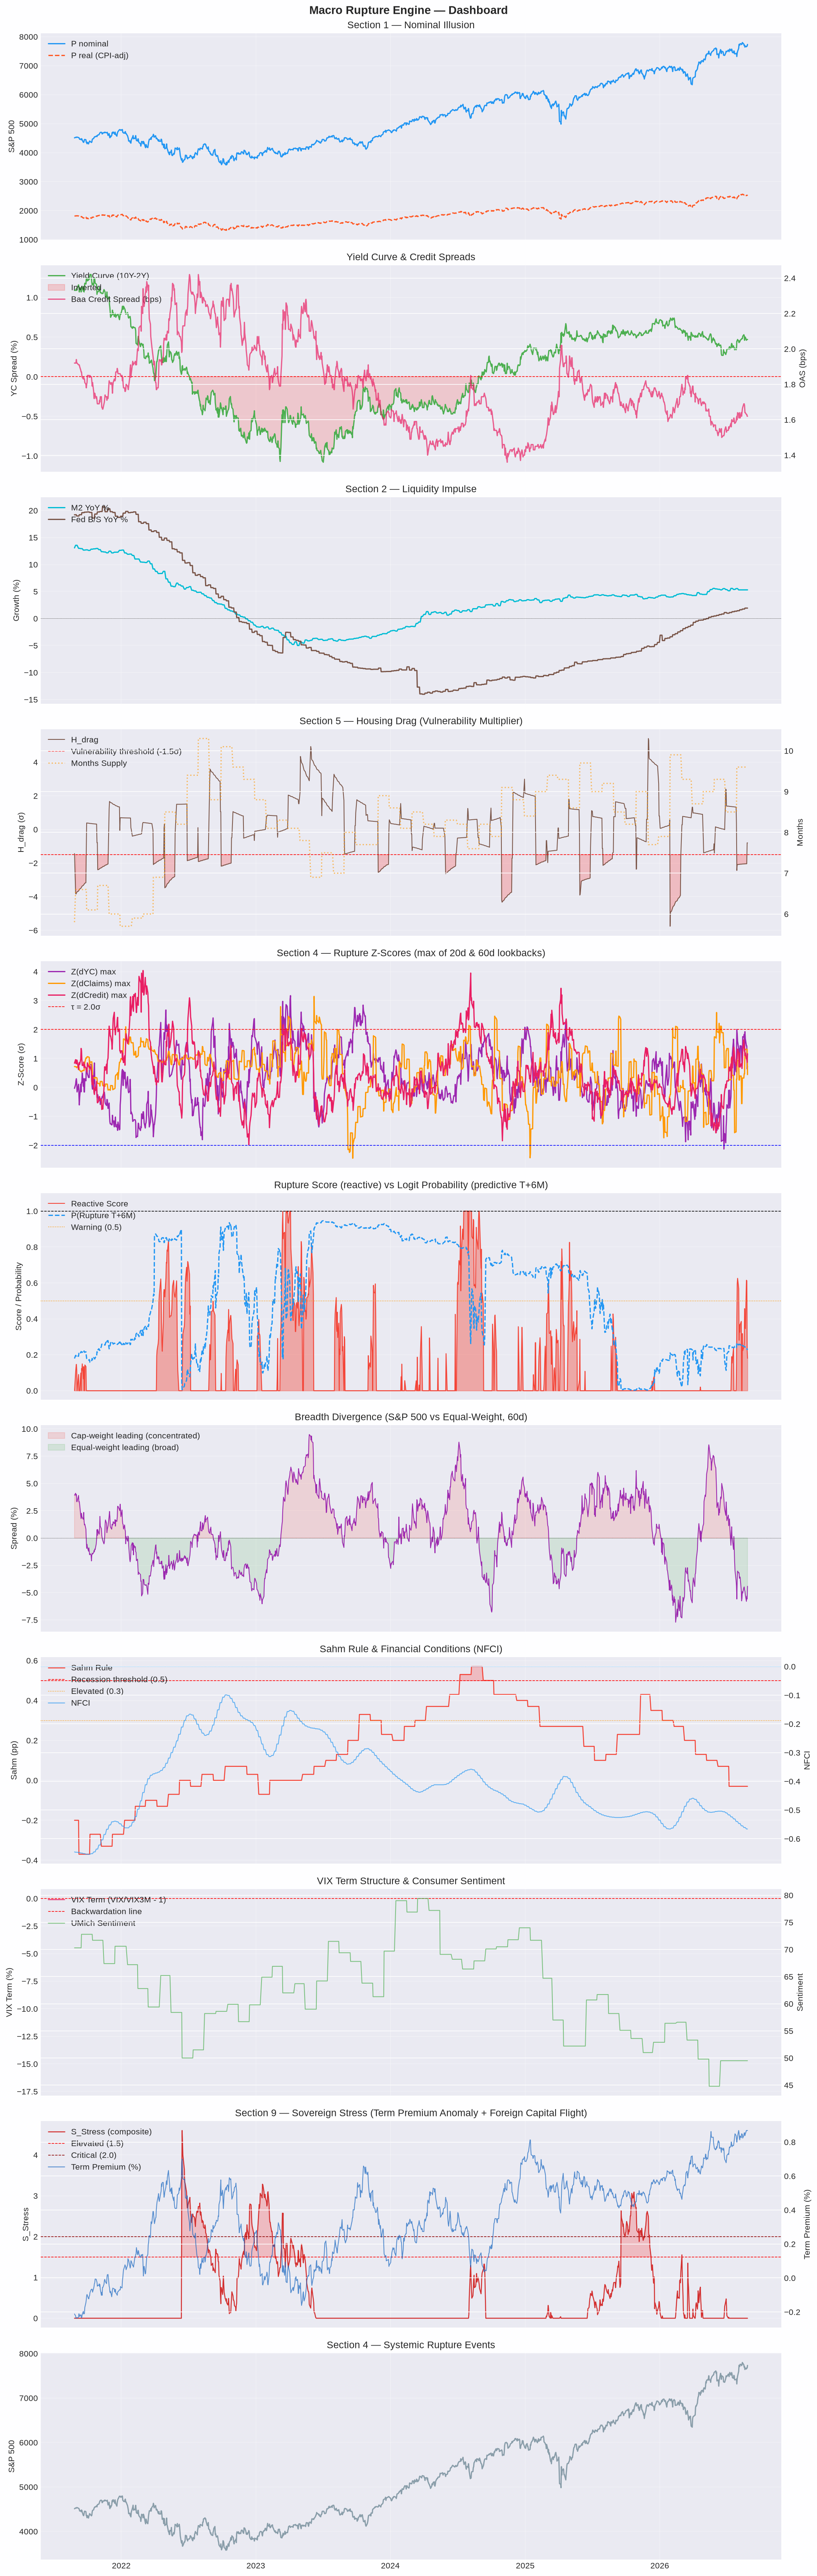
| Yield Curve (10Y-2Y) | 0.47% | 0.72σ |
| Initial Claims | 203000 | 0.44σ |
| Baa Credit Spread | 2 bps | 1.16σ |
| Liquidity Impulse (M2+Fed) | 3.6% | — |
| Regime | Normal | — |
| Inversion Memory (trailing 252d) | 🟢 No | — |
| Indicator | Value | Status |
|---|---|---|
| Sahm Rule (real-time) | -0.03 | 🟢 Normal |
| NFCI (Financial Conditions) | -0.57 | 🟢 Loose |
| Consumer Sentiment (UMich) | 49.5 | 🔴 Depressed |
| VIX Term Structure | -17.0% | 🟢 Contango (complacent) |
Sahm Rule: 3-month avg unemployment rate rises ≥0.5pp from 12-month low → recession. NFCI > 0 = tighter-than-average conditions. VIX backwardation = near-term fear exceeds medium-term.
| Metric | 1Y Return |
|---|---|
| Nominal | 19.3% |
| Real (CPI-adjusted) | 15.9% |
| Divergence | 3.4% |
| Metric | YoY |
|---|---|
| M2 Money Supply | 5.3% |
| Fed Balance Sheet | 1.9% |
| Composite Impulse | 3.6% |
| Metric | Value |
|---|---|
| New Home Sales (HSN1F) | 607 |
| Months Supply (MSACSR) | 9.6 |
| Units Under Construction | 1262 |
| H_drag | -0.80σ |
| Housing Vulnerable | 🟢 No |
When H_drag < -1.5σ (sales collapsing + inventory building), the regime weight is boosted by +0.5, making the rupture score sensitive even without full yield curve inversion.
| Metric | Value | Status |
|---|---|---|
| 10Y Term Premium (ACM) | 0.87% | 🟢 Normal |
| Term Premium Z (compression) | -1.84σ | 🟢 |
| Foreign Holdings (FDHBFIN) | $9.27T | — |
| Z(ΔForeign Holdings YoY) | -1.08σ | 🔴 Liquidating |
| S_Stress (composite) | 0.00 | 🟢 Normal |
S_stress measures the anomaly of sovereign debt demand. High values indicate the Term Premium is irrationally suppressed below its long-term mean while foreign central banks are actively liquidating US debt — a precursor to violent yield spikes. If the term premium mean-reverts to its historical 2.5% average, 10Y yields could spike to 6%+, causing 20-25% additional bond losses and fracturing the credit system.
Display-only overlay. Proxy vectors are explicitly labeled; the EDGAR tech vector is the hard-data anchor. This feature does not feed Rupture_Score, the logit, or the backtest.
| Vector | Latest Value | Z | Fidelity Weight | Subscore | State |
|---|---|---|---|---|---|
| Technological Hyper-Leverage (hard EDGAR) | 0.70 | 0.92 | 1.00 | 0.31 | Clear |
| Shadow Spread (proxy: beta-stripped BDC drift) | 0.07 | 0.95 | 0.60 | 0.00 | Clear |
| Cov-lite / Risk Appetite Proxy (FRED HY OAS) | 2.67 | -1.21 | 0.40 | 0.40 | Clear |
| Power Infrastructure Stress (proxy) | 0.04 | -0.50 | 0.40 | 0.00 | Clear |
| Contagion Multiplier | Value |
|---|---|
| E_contagio | Manual public estimate (Preqin-grade data gated): allocation 15.0% vs. baseline 15.0% → multiplier 1.00 |
| Active weights used | tech_hyperleverage=1.0, shadow_spread=0.6, cov_lite_proxy=0.4, power_stress=0.4 |
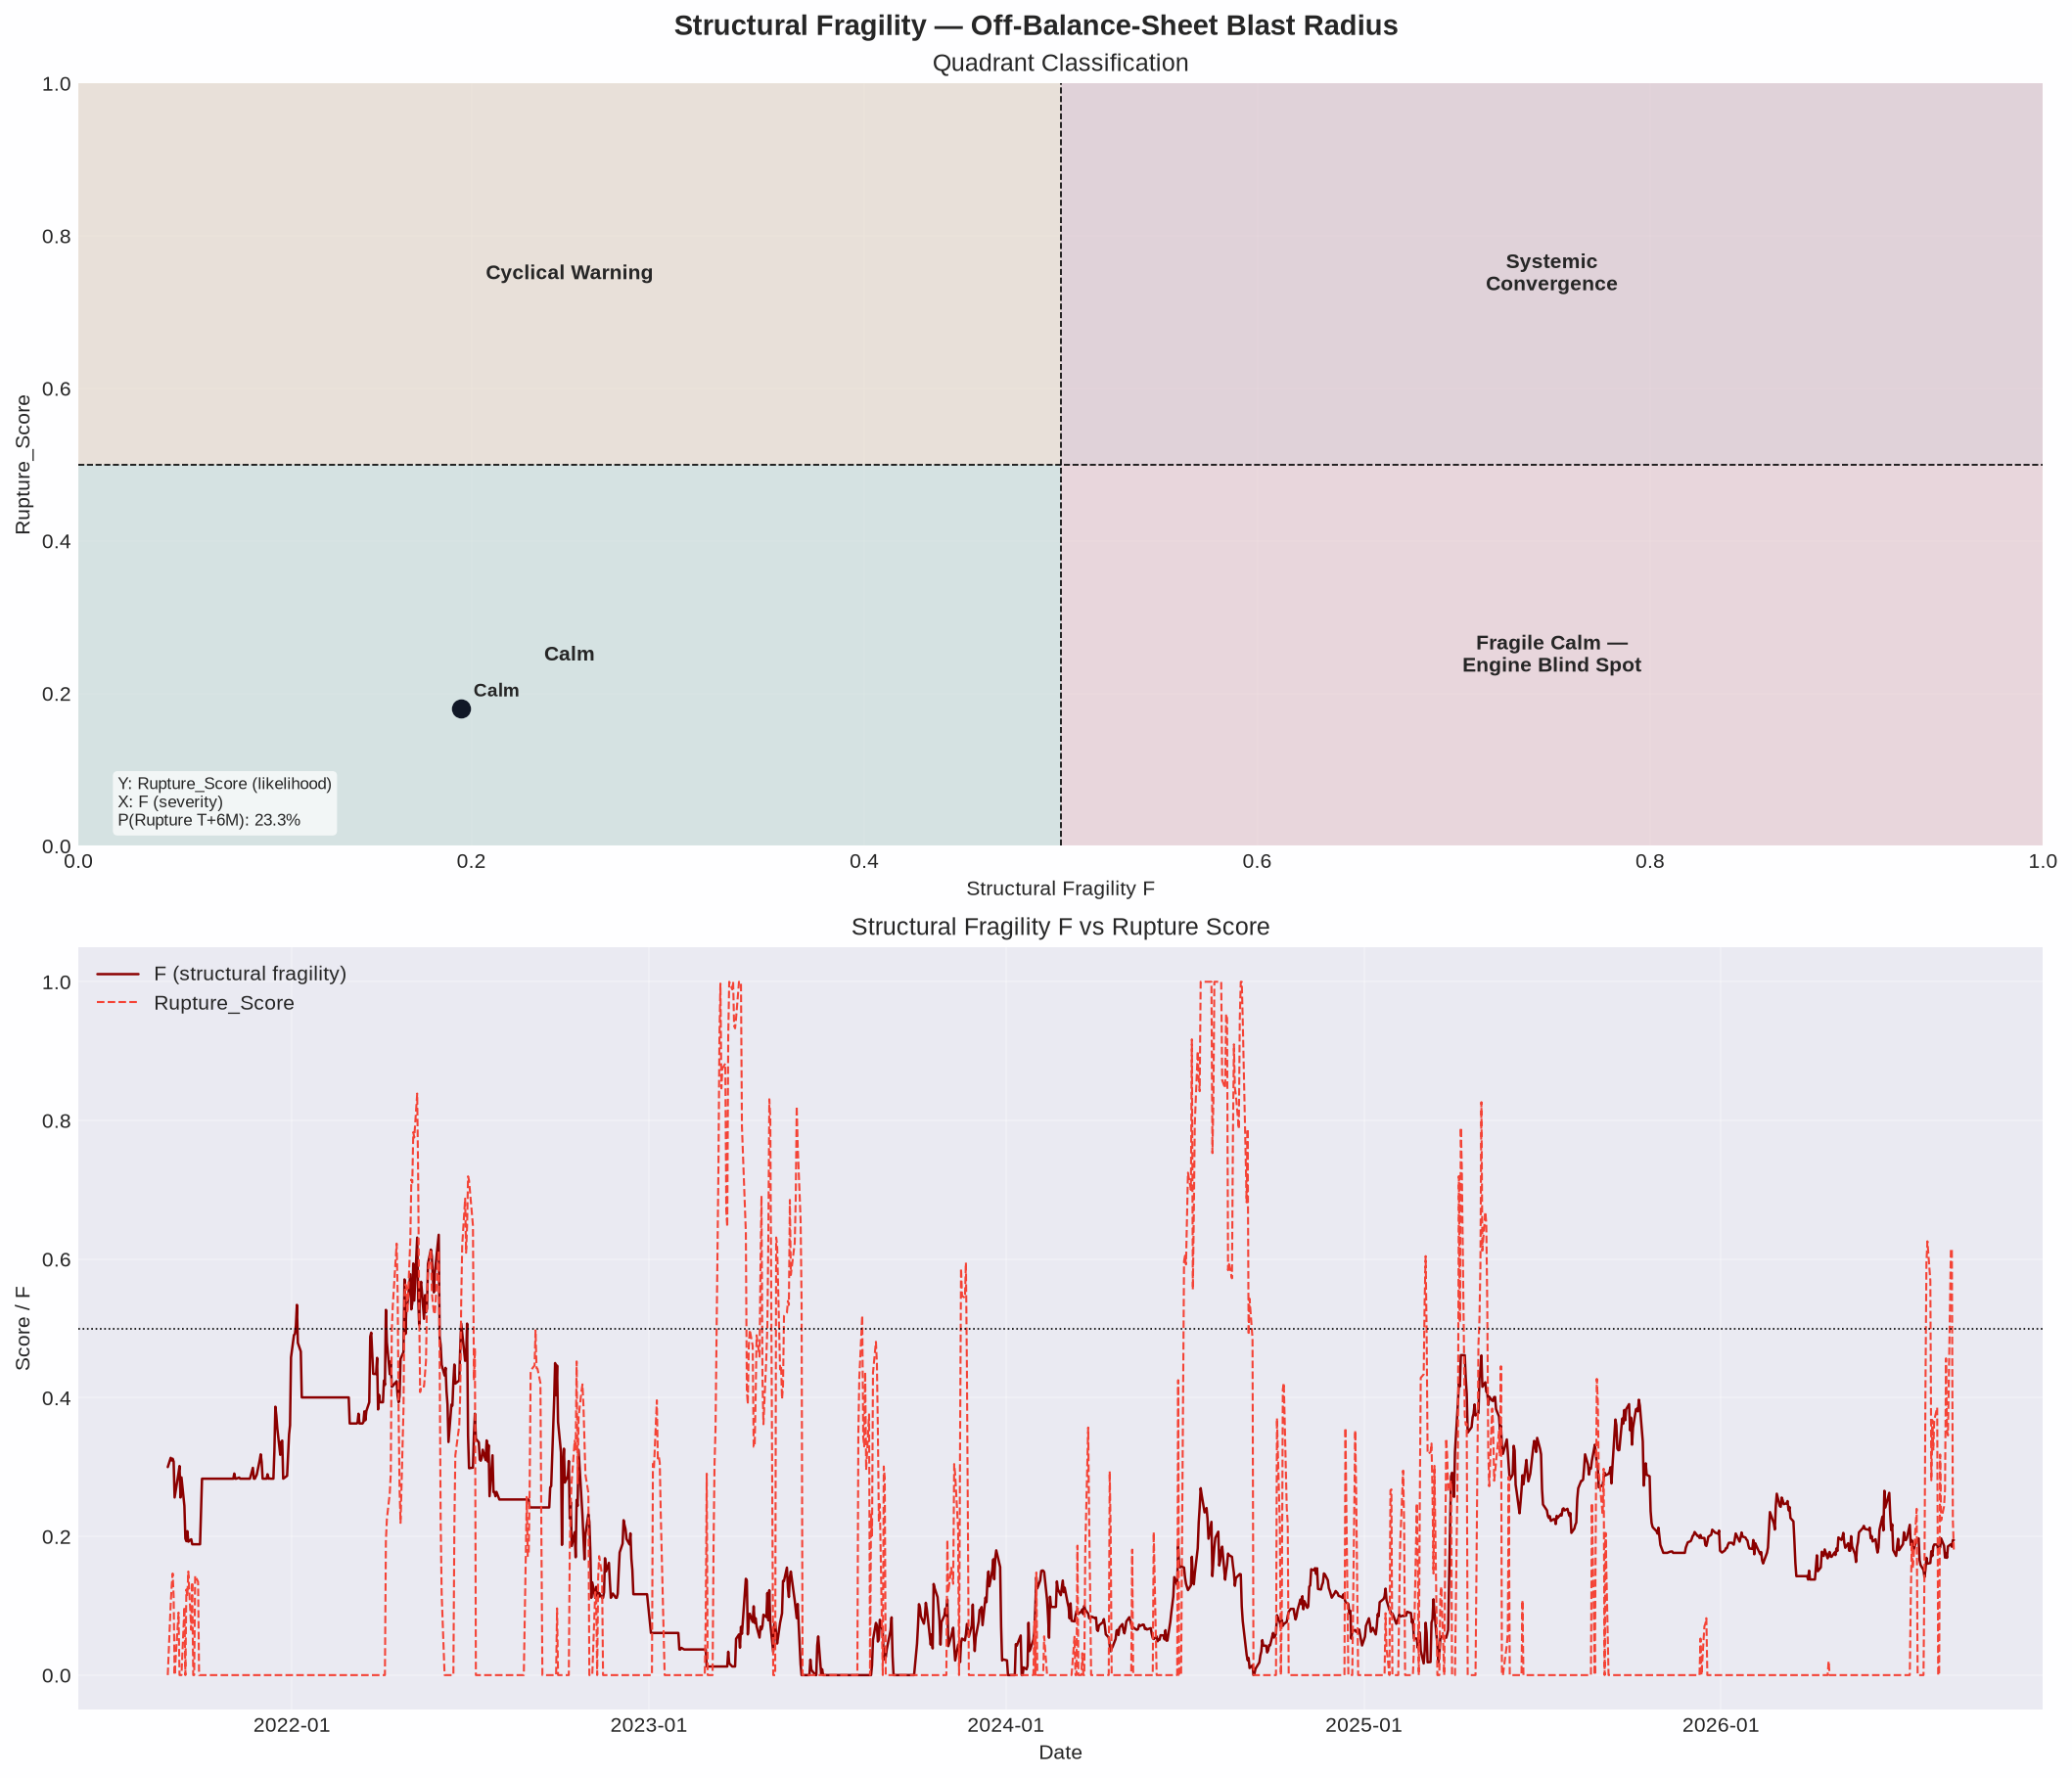
| Structural Fragility Index F | 19.5% |
| Raw F before contagion | 19.5% |
| Current 2D Point | Rupture_Score=0.18 / F=0.19 / P(Rupture T+6M)=23.3% |
| Quadrant | Calm — Low likelihood / low severity |
Axes: X = F (severity / blast radius, threshold 0.5); Y = Rupture_Score (likelihood, threshold 0.5).
| Leg | Z-Score (max) | Status |
|---|---|---|
| Yield Curve Steepening | 0.72σ | 🟢 |
| Unemployment Claims | 0.44σ | 🟢 |
| Credit Spread Widening | 1.16σ | 🟡 |
| Sahm Rule (4th leg) | -0.03 | 🟢 |
| Regime Filter (Inversion Memory) | 0.47% | 🟢 Clear |
| Date | YC | Z(dYC) | Z(dClaims) | Z(dCredit) | Sahm | Score | P_nominal |
|---|---|---|---|---|---|---|---|
| 2007-12-05 | 1.02 | 2.43 | 2.14 | 2.91 | 0.23 | 1.00 | 1485 |
| 2008-01-04 | 1.14 | 2.29 | 2.08 | 2.19 | 0.40 | 1.00 | 1412 |
| 2008-01-07 | 1.10 | 2.15 | 2.07 | 2.43 | 0.40 | 1.00 | 1416 |
| 2008-01-09 | 1.13 | 2.44 | 2.10 | 2.53 | 0.40 | 1.00 | 1409 |
| 2020-03-19 | 0.68 | 5.08 | 4.63 | 6.89 | 0.30 | 1.00 | 2409 |
| 2020-03-20 | 0.55 | 3.81 | 4.43 | 6.89 | 0.30 | 1.00 | 2305 |
| 2020-03-23 | 0.48 | 3.10 | 4.25 | 6.78 | 0.30 | 1.00 | 2237 |
| 2020-03-24 | 0.46 | 2.77 | 4.09 | 6.35 | 0.30 | 1.00 | 2447 |
| 2020-03-25 | 0.54 | 3.06 | 3.94 | 5.61 | 0.30 | 1.00 | 2476 |
| 2020-03-26 | 0.53 | 2.74 | 15.74 | 5.16 | 0.30 | 1.00 | 2630 |
| Recession | Score Warnings | Score Lead (d) | Peak Score | Max Drawdown |
|---|---|---|---|---|
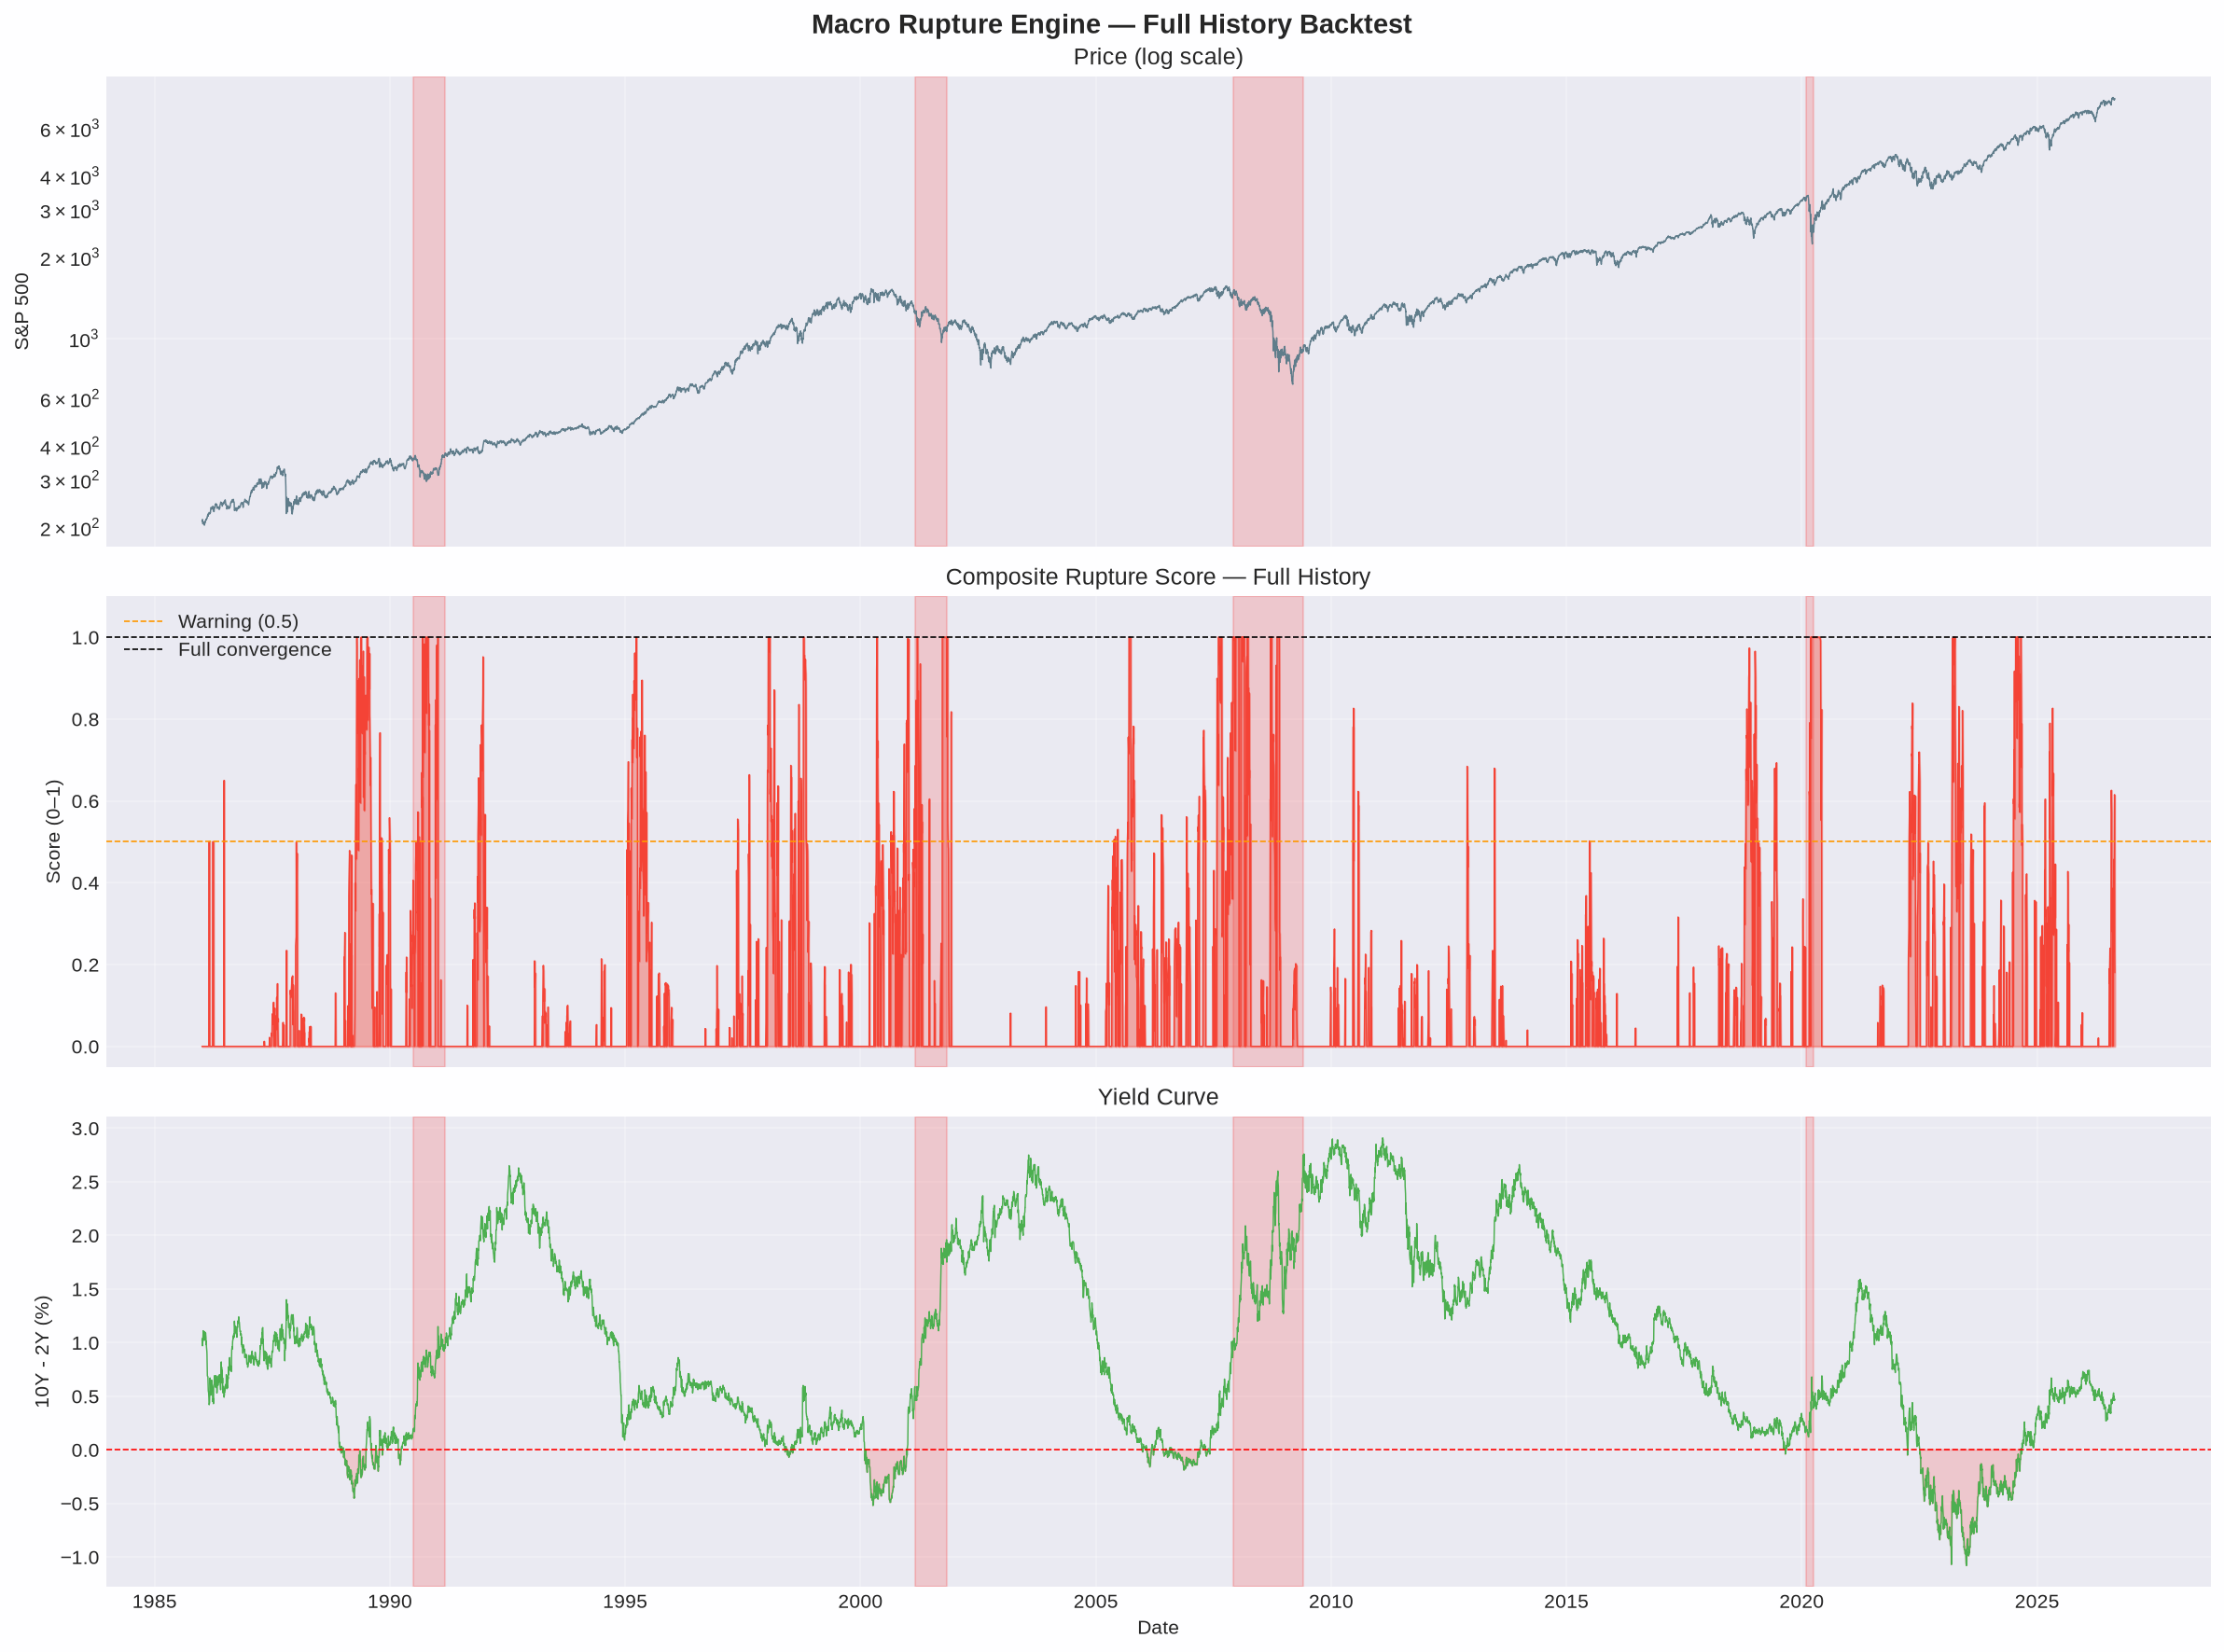
| 1990-07-01 → 1991-03-01 | 29 | 363 | 1.00 | -19.9% |
| 2001-03-01 → 2001-11-01 | 38 | 302 | 1.00 | -26.4% |
| 2007-12-01 → 2009-06-01 | 72 | 361 | 1.00 | -55.4% |
| 2020-02-01 → 2020-04-01 | 12 | 243 | 0.69 | -33.9% |
| Metric | Value |
|---|---|
| S&P 500 vs Equal-Weight (60d) | -4.42% |
| Interpretation | 🟢 Broad participation |
A sustained positive spread (cap-weight outperforming equal-weight) signals capital concentration into mega-caps, masking erosion in mid/small-caps.
Based on $E_{max} = 1 - \hat{P}(Rupture)$:
| Parameter | Value |
|---|---|
| P(Rupture T+6M) | 23.3% |
| Max Equity Exposure | 76.7% |
| Minimum Cash/ST Bonds | 23.3% |
| Score Range | Assessment | Suggested Action |
|---|---|---|
| < 0.3 | 🟢 Nominal | Standard allocation |
| 0.3 – 0.6 | 🟡 Elevated | Review hedging positions |
| 0.6 – 0.8 | 🟠 Warning | Reduce risk exposure |
| > 0.8 | 🔴 Critical | Defensive posture |
Score thresholds derived from backtest: Composite Score > 0.5 preceded or accompanied every major drawdown since 1990.
The Systemic Rupture signal ($C$) activates when three Z-score legs simultaneously exceed the threshold $\tau$ with inversion memory active:
Where $Z^{max} = \max(Z_{20d}, Z_{60d})$ captures both fast and slow-building stress, and $I_{mem} = 1$ if the yield curve was inverted at any point in the trailing 252 days.
The Composite Rupture Score uses a weighted geometric mean (replacing the prior $\min$ operator):
Where $S_{boost} = 1 + \text{Sahm}$ when Sahm ≥ 0.3 (labor market confirmation), and $w_{regime}$ incorporates inversion memory, housing vulnerability (+0.5), NFCI tightening (+0.25), and sovereign stress (+0.25/+0.5 when $S_{stress}$ > 0.75/1.5).
Z-scores are computed over a 252-day rolling window using both 20-day and 60-day derivatives (max of both horizons).
| Series | Frequency | Last Updated | Next Release | Source |
|---|---|---|---|---|
| Yield Curve (10Y-2Y) (T10Y2Y) | D | 2026-08-26 | 2026-11-24 | Interest Rate Spreads |
| Initial Jobless Claims (ICSA) | W | 2026-08-27 | 2026-09-03 | Unemployment Insurance Weekly Claims Rep |
| CPI (All Urban) (CPIAUCSL) | M | 2026-08-12 | 2026-09-11 | Consumer Price Index |
| Baa Corporate Bond Spread (BAA10Y) | D | 2026-08-26 | 2026-11-24 | Interest Rate Spreads |
| M2 Money Supply (WM2NS) | W | 2026-08-25 | 2026-09-22 | H.6 Money Stock Measures |
| Fed Balance Sheet (WALCL) | W | 2026-08-20 | 2026-09-03 | H.4.1 Factors Affecting Reserve Balances |
| New Home Sales (HSN1F) | M | 2026-08-25 | 2026-09-24 | New Residential Sales |
| Months Supply (New Homes) (MSACSR) | M | 2026-08-25 | 2026-09-24 | New Residential Sales |
| Housing Under Construction (UNDCONTSA) | M | 2026-08-18 | 2026-09-17 | New Residential Construction |
| Sahm Rule Recession Indicator (SAHMREALTIME) | M | 2026-08-07 | 2026-09-04 | Sahm Rule Recession Indicator |
| Financial Conditions Index (NFCI) | W | 2026-08-26 | 2026-09-02 | Chicago Fed National Financial Condition |
| Consumer Sentiment (UMich) (UMCSENT) | M | 2026-07-31 | 2026-08-28 | Surveys of Consumers |
| 10-Year Term Premium (ACM) (THREEFYTP10) | D | 2026-08-25 | — | An Arbitrage-Free Three-Factor Term Stru |
| Federal Debt Held by Foreign Investors (FDHBFIN) | Q | 2026-06-18 | — | Treasury Bulletin |
Release dates sourced from FRED API (fred/release/dates). Future dates are estimates and may shift.
This engine is a research project and not financial advice. It uses historical data and statistical methods that may not predict future outcomes. Always conduct your own research and consult a financial advisor before making investment decisions.